Platform
Built for the complexity of scientific data
Labric unifies instruments, spreadsheets, and databases into a single platform built for scientific research.
Transform how your lab works
Traditional lab workflows
Data trapped on disconnected instruments
Manual transfers via email and USB
Context lost in paper notebooks
Siloed spreadsheets per researcher
Week-long delays before analysis
No reproducibility audit trail
With Labric
Automatic real-time capture
Instant database availability
Metadata captured automatically
Unified view across all experiments
One-week deployment
Data provenance records
Sync
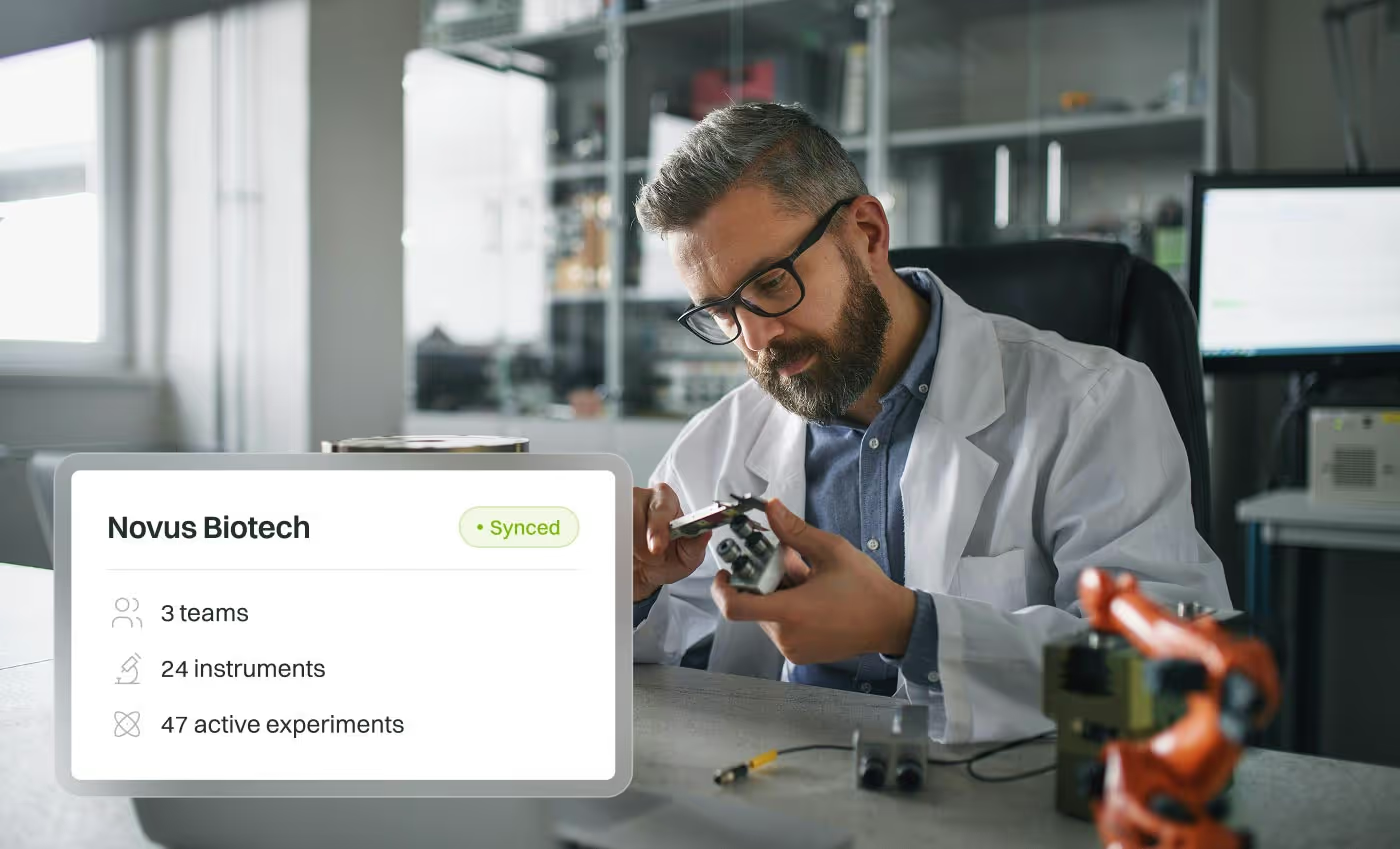
Connect every data source in your lab
Most labs have data scattered across dozens of instruments, spreadsheets, and databases. Labric's desktop app automatically captures and centralizes everything, creating a single source of truth for your research.
How it works
Our desktop application provides real-time file monitoring and automatic data ingestion with parsers for hundreds of instrument file formats.
Instrument integration
Connect to lab instruments and automatically parse raw output files across hundreds of formats.
Real-time monitoring
Watch folders for new files, then automatically stream and ingest data as it's generated.
Spreadsheet import
Use your current data structure, with automatic future imports after one-time column mapping.
Structure
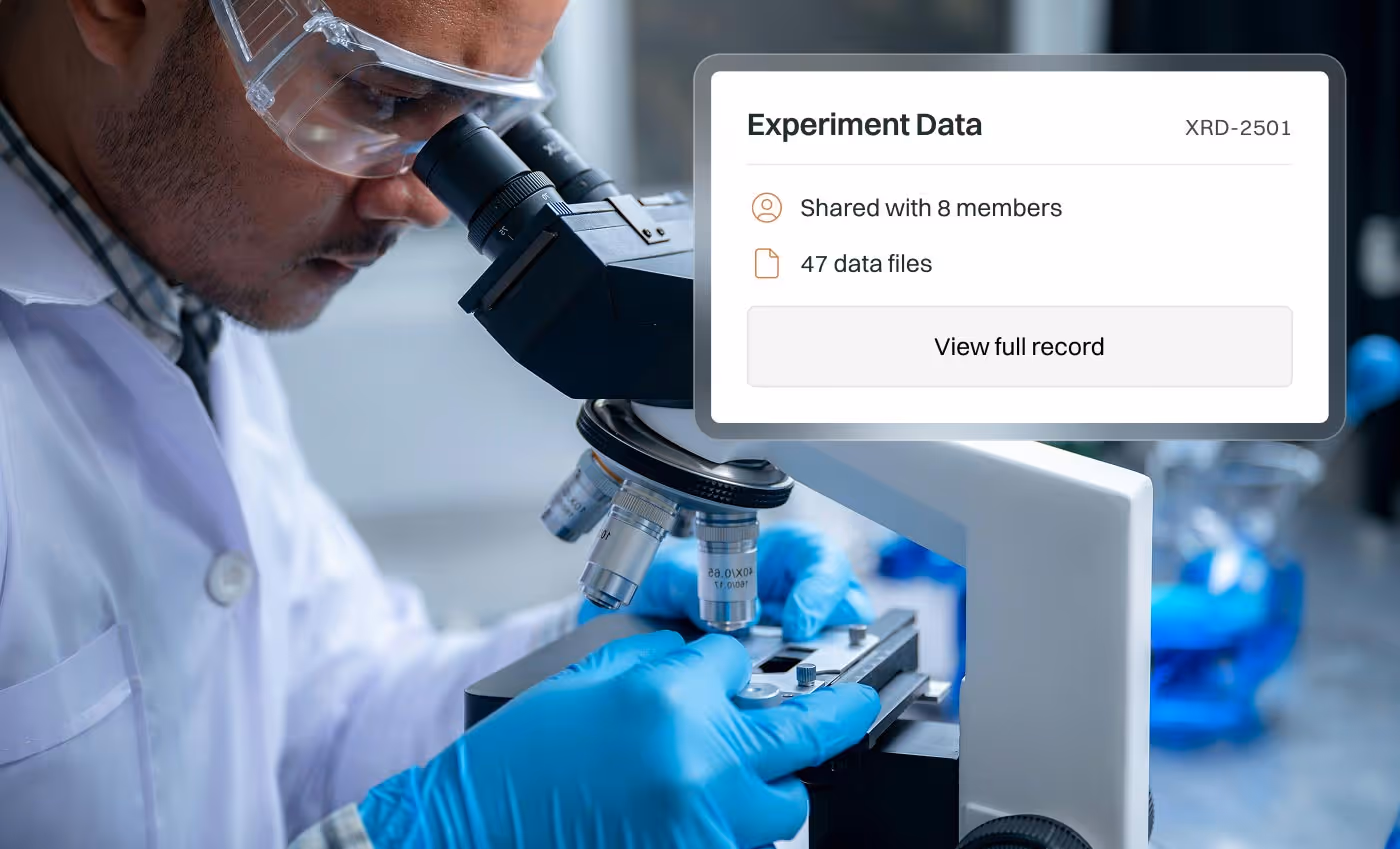
Custom database, zero configuration
Every lab works differently. Labric builds a database schema tailored to your specific experimental workflows, enabling powerful cross-experiment analysis without forcing you into a rigid structure.
How it works
We collaborate with you during setup to design a database schema matching your experimental workflows.
Custom schema design
Benefit from a database schema that matches how you think about your experiments and workflows.
Automatic normalization
Normalize and validate incoming data against your schema, catching errors at ingestion time.
Cross-experiment queries
Query across all experiments with SQL or visual query builder to surface larger patterns.
Run
Automate workflows with event-driven triggers
Stop manually running the same analysis scripts every time you get new data. Labric's infrastructure lets you build sophisticated workflows that execute automatically, freeing your team to focus on the science.
How it works
Our workflow builder lets your scripts run with event-driven triggers and full job monitoring, and our Python SDK provides programmatic access to your data.
Event-driven triggers
Kick off workflows automatically based on different conditions, like new data arriving.
Python SDK
Write jobs in Python with our SDK to access data, run computations, and record derived results.
Job monitoring
Track job status, view logs, and debug from a unified dashboard with alerts for failures.
Analyze
AI-powered insights from your structured data
With your lab's data properly structured and contextualized, AI becomes dramatically more powerful. Ask questions in natural language, generate visualizations instantly, and build reports that update automatically as new experiments complete.
How it works
Natural language queries leverage LLMs with access to your data and schema, supporting hosted or bring-your-own deployments including on-premise options.
Natural language queries
Ask questions in plain English and get answers backed by your data.
Bring your own LLM
Use our hosted models or connect your own, with on-premise support.
Interactive visual reports
Generate publication-quality plots and interactive dashboards.
Solutions
Enterprise scale, academic flexibility
Enterprise
One scalable platform for your entire organization. Collaborate across teams with enterprise-grade security.
Academia
Cutting-edge infrastructure at academic pricing. Ensure reproducibility and continuity across your lab.
20x
faster experimental cycle times vs. traditional solutions
300+
instruments supported for automatic data ingestion
8 seconds
median time to stream and process new data
Your data, your control
We believe your research data should never be trapped. Labric is built on principles of transparency and data ownership.
Complete data access
Your structured data can be exported or replicated to other databases.
Keep your parsers
Source code for all custom parsers we build for your instruments is available to you.
Open architecture
All platform GUI functionality is backed by open API routes, callable with our SDK.


Works with the instruments you already have
Labric connects to instruments from manufacturers across every scientific discipline. Our parsers handle esoteric file formats from mass spectrometers to microscopes to custom lab equipment. If your instrument outputs data, Labric can ingest it.
Automatic file detection and parsing
Existing support for 300+ instruments
Custom parser development for new formats
No manual exports or copy-paste workflows
Frequently asked questions
- All data is encrypted in transit and at rest. SOC 2 Type II certification is underway, and we provide full compliance documentation on request.
- Labric supports cloud, hybrid, or on-premise deployment so your data stays where your policies require.
- You can bring your own LLM provider to ensure sensitive research data never leaves your approved infrastructure.
- Labric works with any instrument that produces files or has internal file storage. If your instrument generates data, we can connect to it.
- Integrations with Excel, Google Sheets, existing databases, LIMS, ELNs, Notion, and Google Drive.
- For specialized or legacy instruments, our team builds parsers during onboarding at no extra charge.
- Labric Sync includes a historical backfill feature that uploads older data sitting on your instrument computers, so your archive is available from day one.
- We also support bulk imports from existing databases, shared drives, and cloud storage during onboarding.
- Your historical data gets the same structured schema and searchability as newly synced files.
- During onboarding, we work with your team to map the relationships between your instruments, experiments, samples, and results into a relational schema tailored to how your lab thinks about its data.
- That schema is what makes search, filtering, AI analysis, and cross-experiment comparisons possible across your entire dataset.
- As your research evolves, schemas can be extended without breaking existing data or workflows.
- To get set up, we just ask that you install the Sync app on your instrument computers and meet with us while we design your schema. That's it.
- Most teams onboard without changing anything about how they run experiments or collect data.
- If your team wants to become more organized or implement new practices, we're happy to advise on that too.
- Yes. Most customers begin with a focused pilot, typically one team or one lab, to validate the platform against their workflows.
- Pilots run about 3 months and include full platform access, instrument syncing, custom schema design, and dedicated support.
- No long-term commitment required. We want you to see real results before scaling.